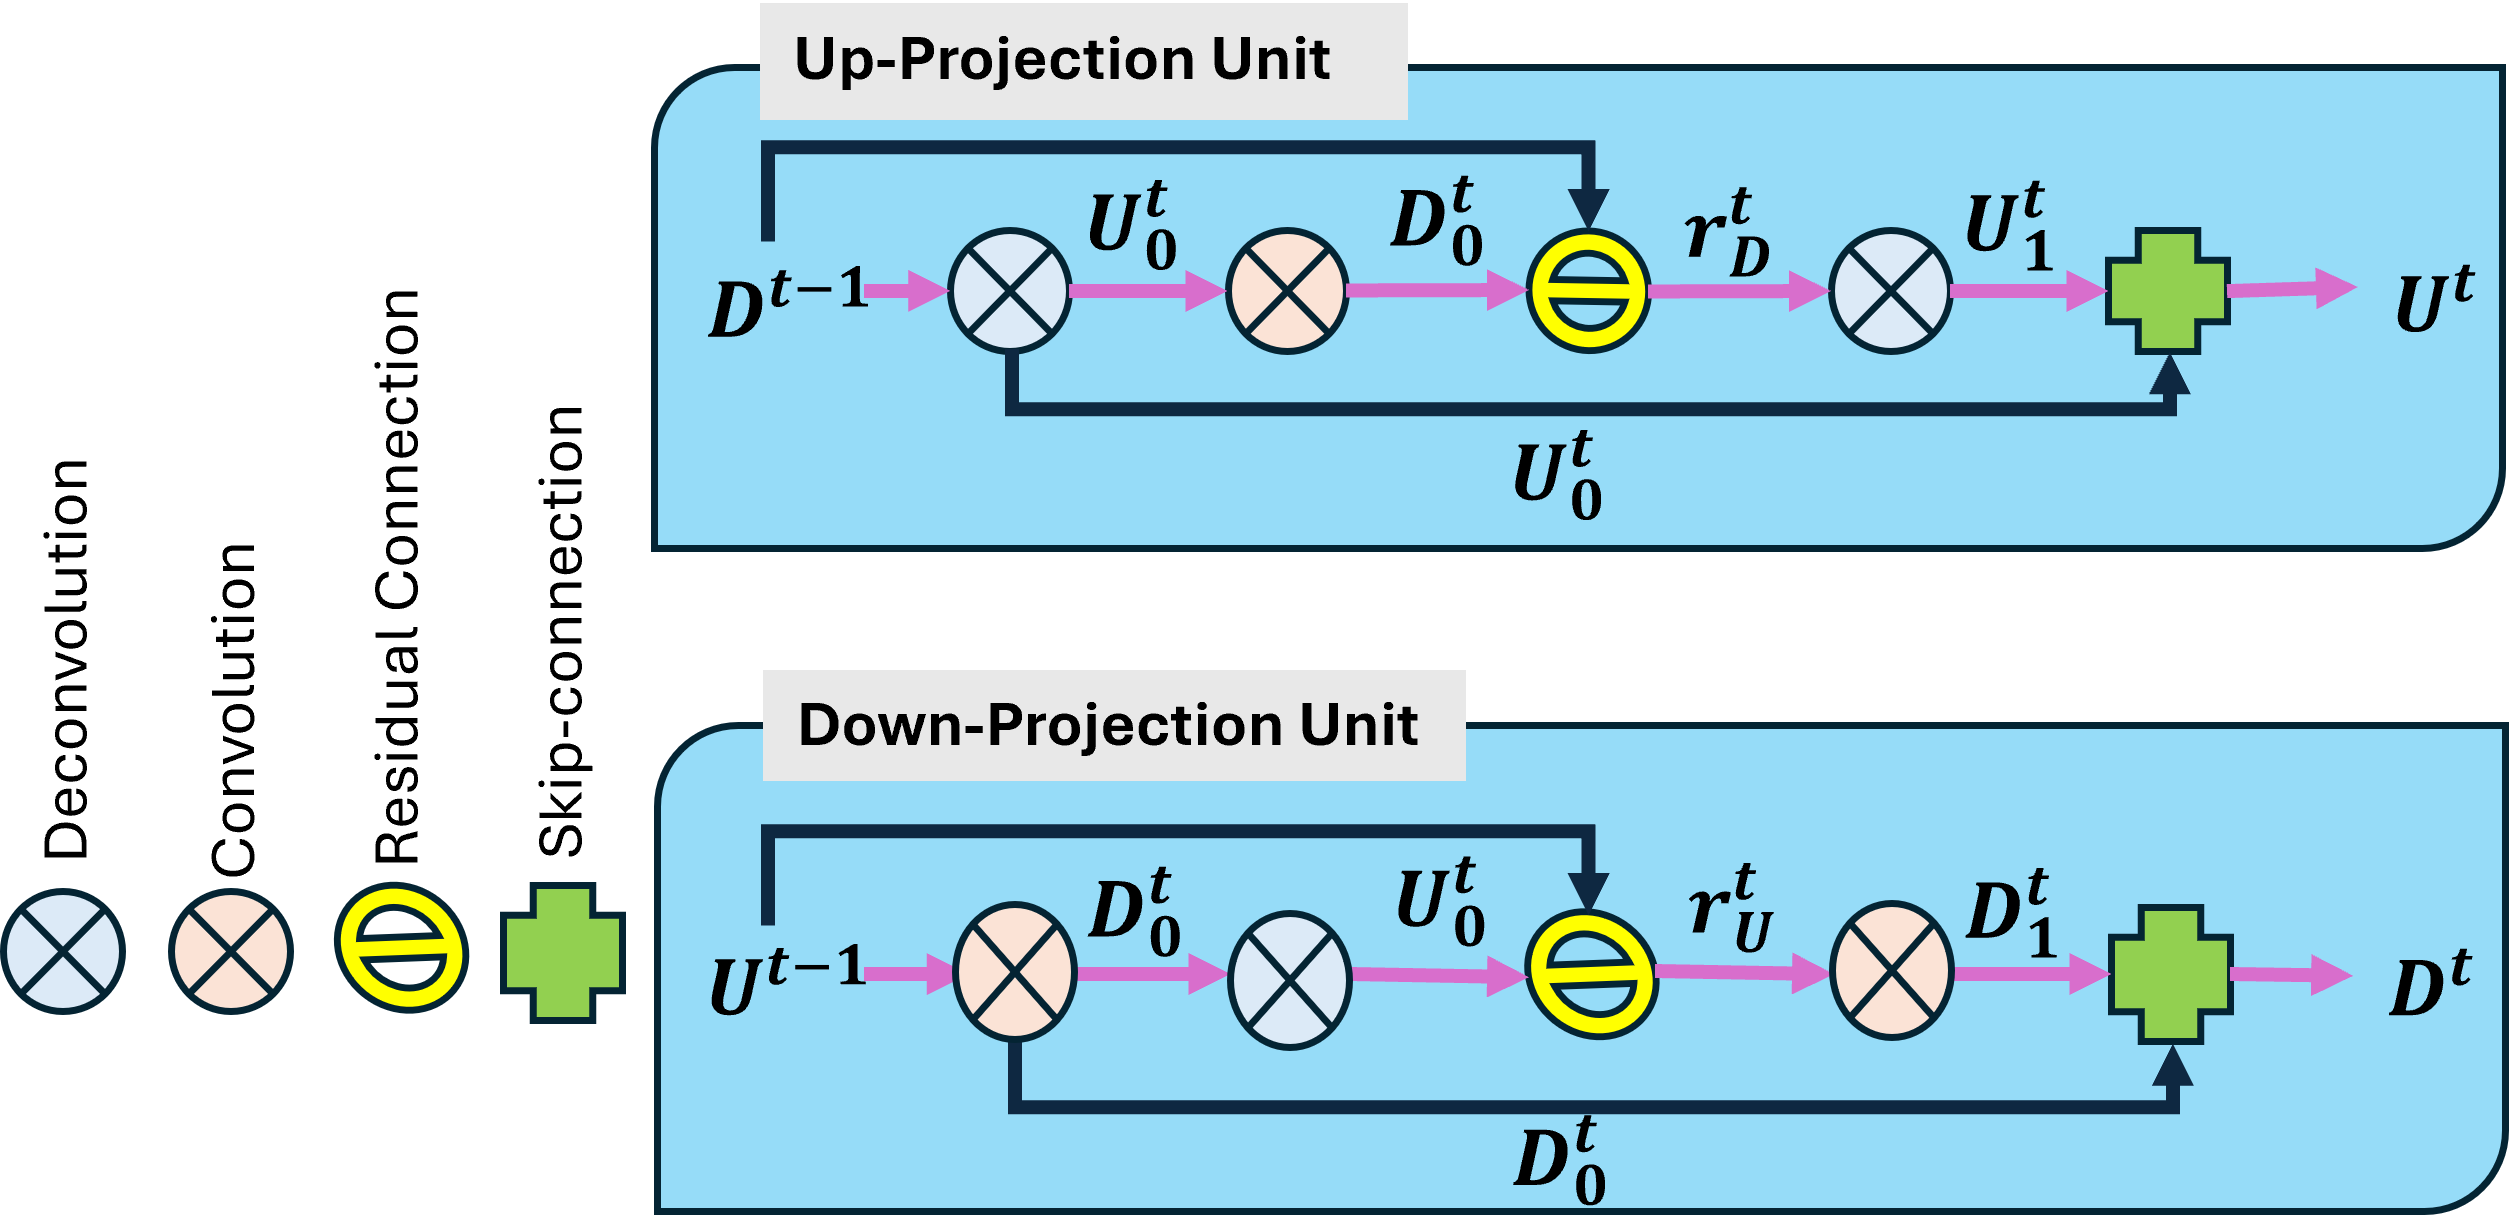
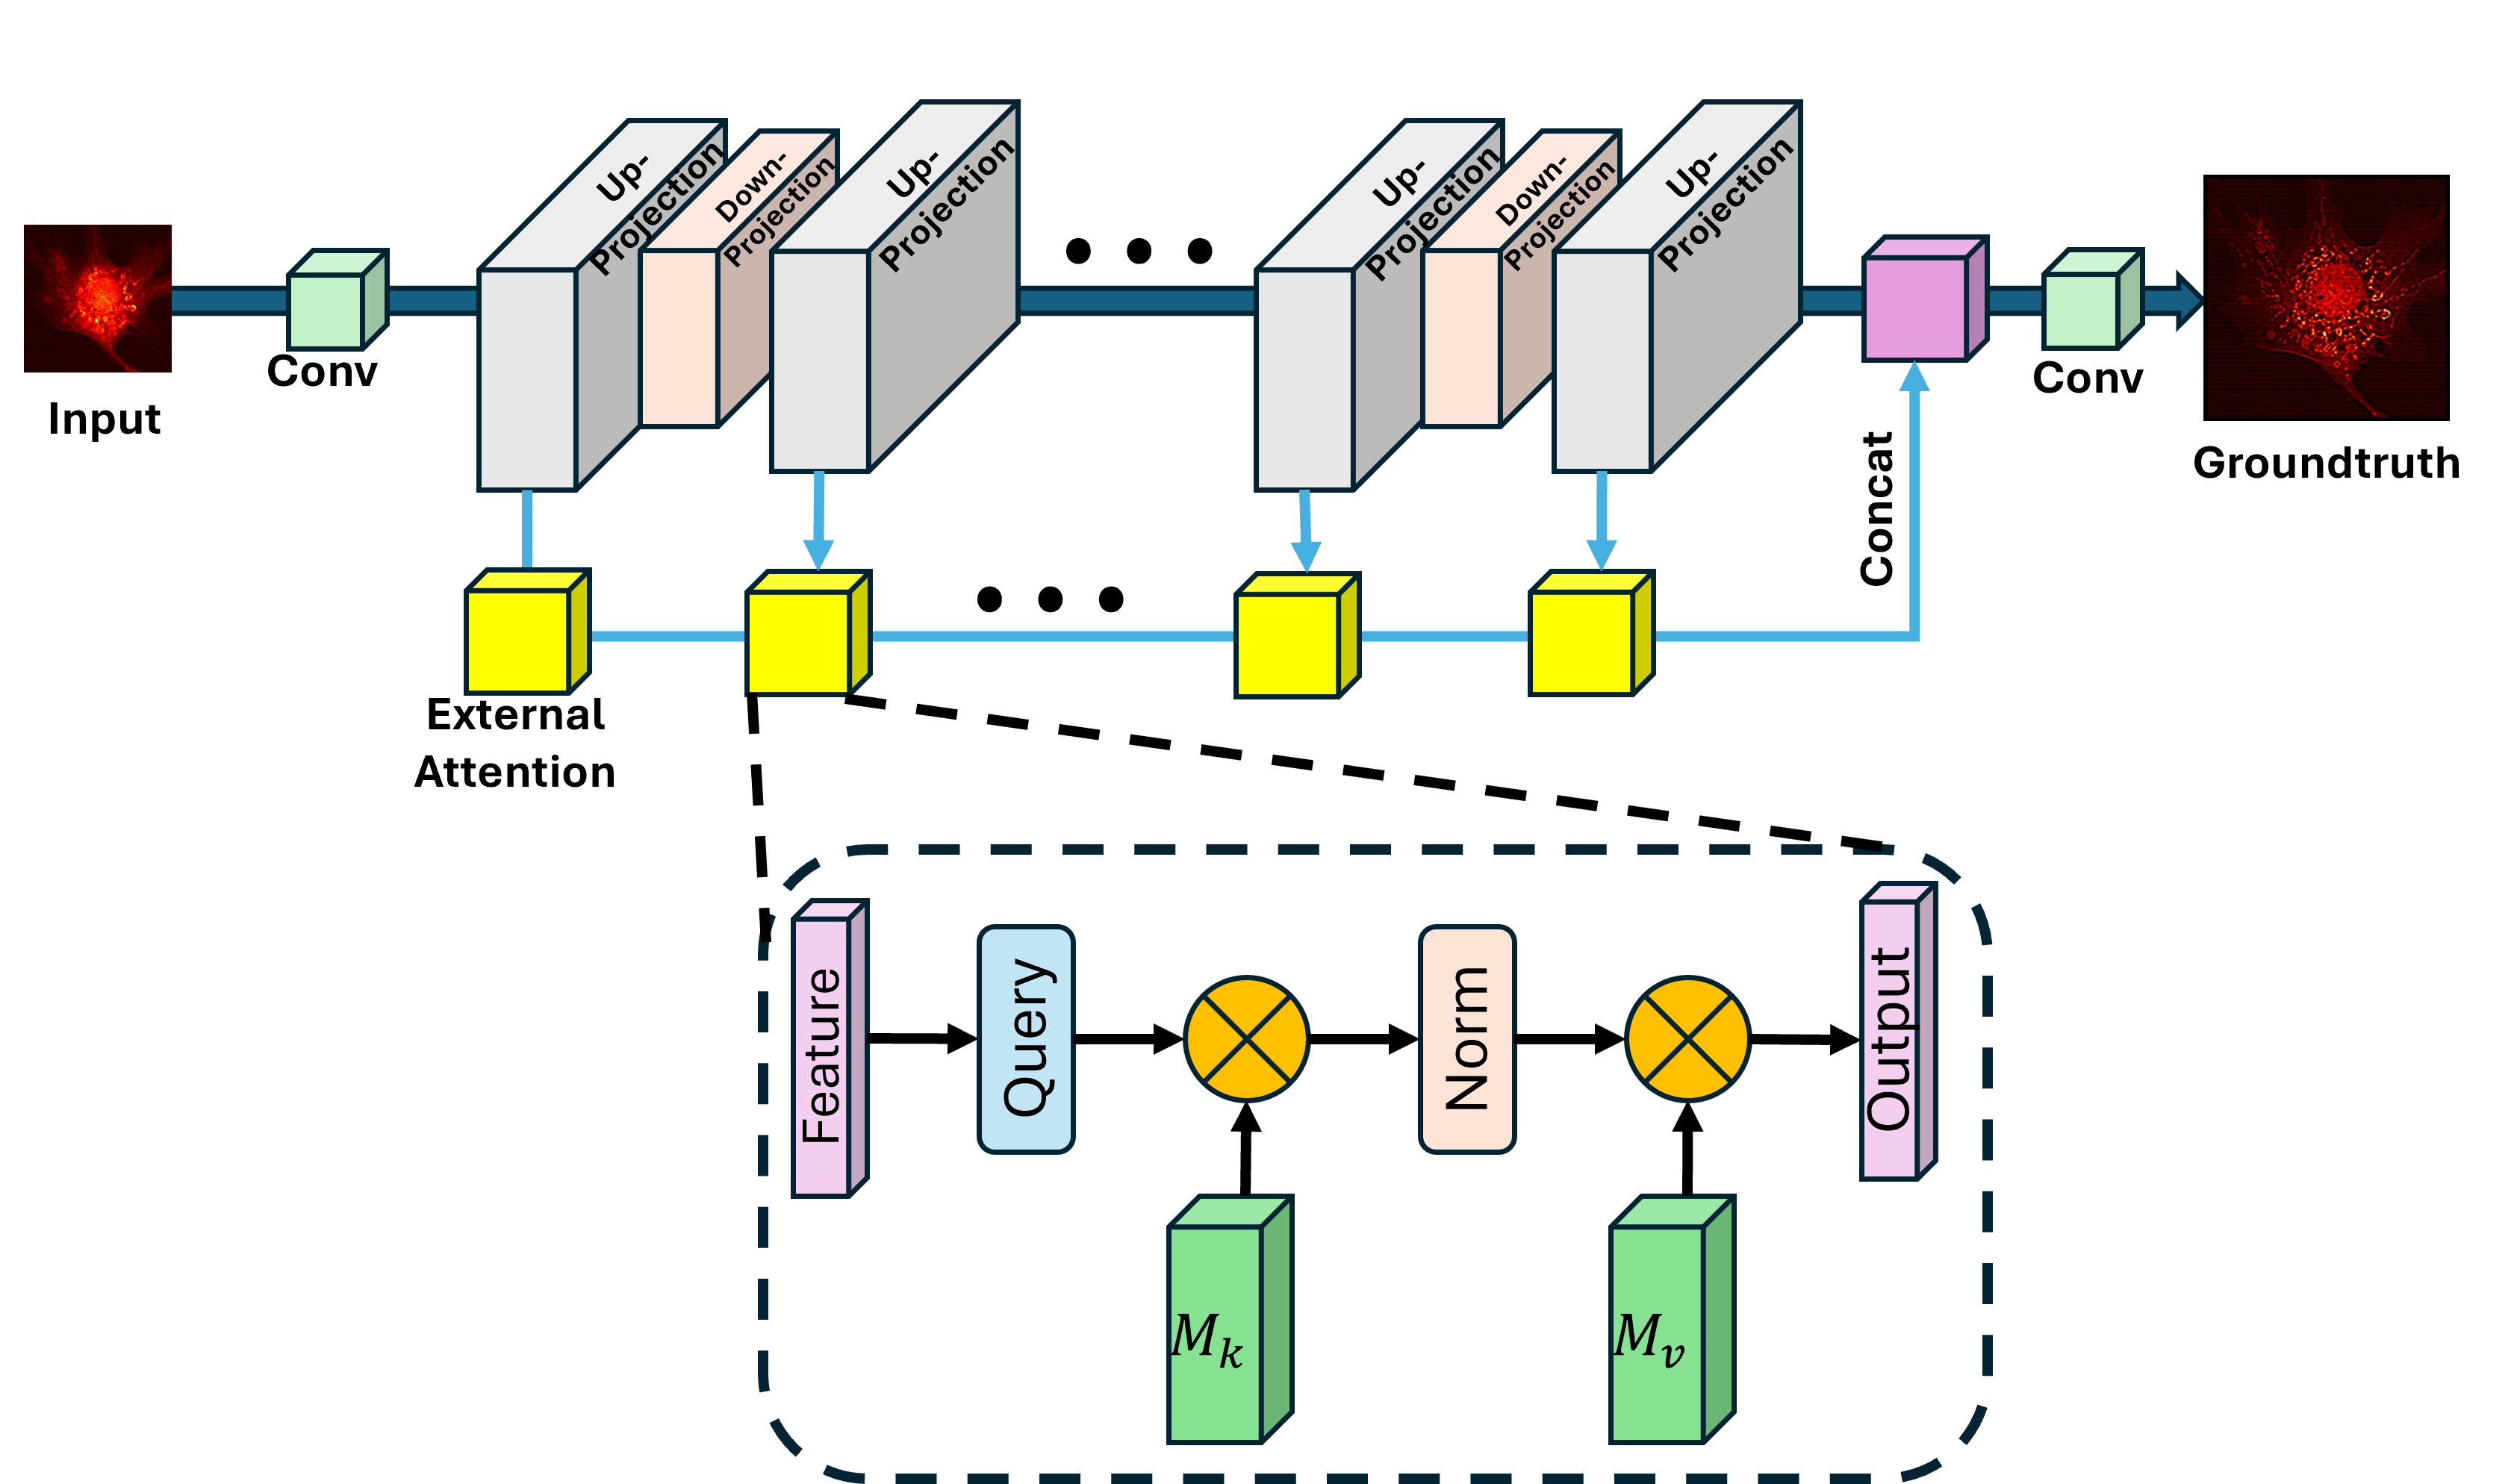
Enhancing Fluorescence Microscopy Resolution Beyond the Diffraction Limit via Cascaded Up- and Down-Sampling Networks

Birla Institute of Technology Mesra, Patna Campus
International Conference on Computer Vision and Image Processing (CVIP-2025)

Model Architecture

Abstract

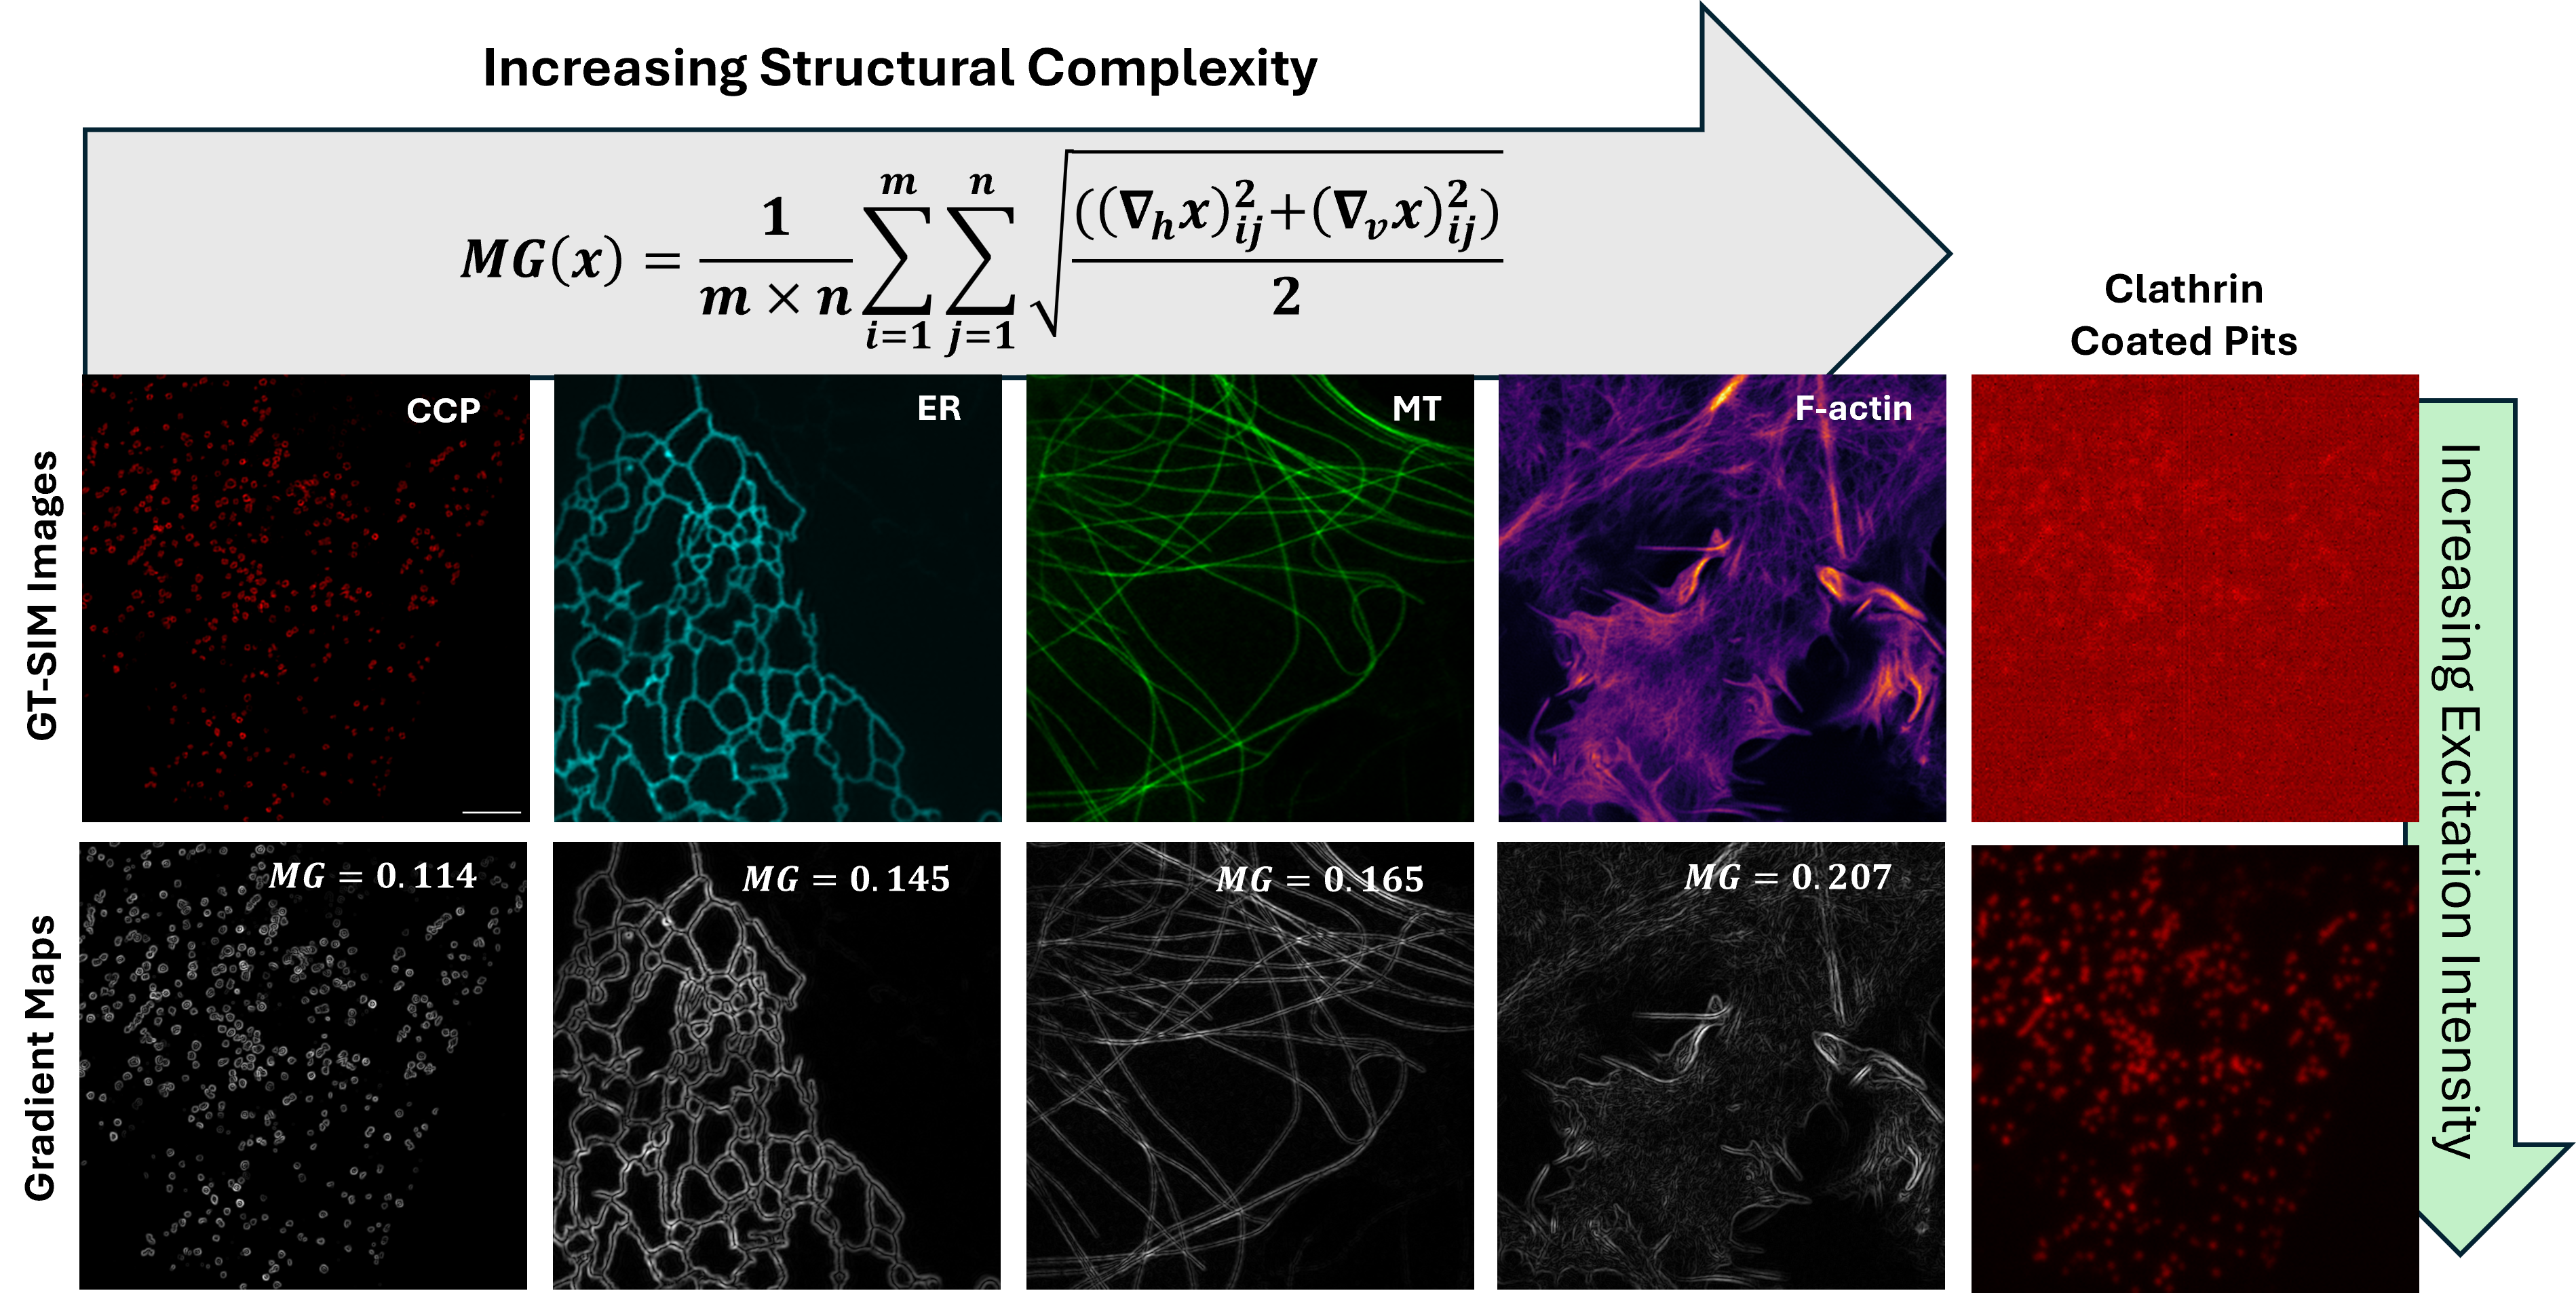
Fluorescence microscopy enables high-contrast visualization of subcellular structures through the use of synthetic fluorescent markers, though it is limited by lower spatial resolution and the risk of photobleaching. Super-resolution (SR) fluorescence microscopy overcomes the diffraction barrier to resolve finer details, but comes with trade-offs such as decreased temporal resolution, the need for sophisticated equipment, optical sectioning requirements, and constraints on the sample’s exposure tolerance.
In this study, we introduce a deep learning model that employs upsampling and downsampling to achieve super-resolution. By connecting up-projection and down-projection blocks in a cascaded arrangement, our model maintains the important relationships between the input low-resolution (LR) images and the target high-resolution (HR) labels. To extract dependencies across various depths, feature maps produced at intermediate upsampling stages are combined. Additionally, external self-attention blocks are integrated after these intermediate up-projection blocks to assess pixel-level affinities. Unlike traditional self-attention mechanisms that focus on correlations within a single sample, our approach uses external attention to capture inter-sample correlations across the entire dataset, offering the added benefit of reduced computational demands.

Dataset Description

MY ALT TEXT

Row 1: Different samples obtained from structured illumination miscroscopy (SIM) (acting as groundtruth data) in increasing levels of structural complexity: clathrin-coated pits (CCP), endoplastic reticulum (ER), microtubules (MT) and F-actin fibers. Row 2: The corresponding gradient maps where structural complexity is measured in terms of grayscale mean gradient (MG) where \(\nabla_hx\) and \(\nabla_vx\) are the gradients across horizontal and vertical axes respectively. The representative widefield CCP images for two different excitation intensities serving as input samples during model training (last column).


Results

Super-resolution under High Fluorescence Excitation Level

(Row 1): Input and super-resolved images inferred from the trained models for different specimen types (clathrin coated pits (CCPs), endoplastic reticulum (ER), microtubules (MT) and F-actin fibers) under high-fluorescence excitation levels. (Row 2): The corresponding zoomed regions.

Super-resolution under Low Fluorescence Excitation Level

(Row 1): Input and super-resolved images inferred from the trained models for different specimen types (clathrin coated pits (CCPs), endoplastic reticulum (ER), microtubules (MT) and F-actin fibers) under low-fluorescence excitation levels. (Row 2): The corresponding zoomed regions.


Uncertainty Quantification

MY ALT TEXT

Resolution Scaled Error Maps (RSM) and rolling Fourier Ring Correlation Maps (rFRC Maps) for different specimen types under the proposed methodology. Also provided are the corresponding metric values: resolution scaled error (RSE), Pearson correlation coefficient (RSP) and structural similarity index (RSSIM). Uncertainty quantification metrics: rFRC value (higher value indicates higher confidence in the reconstructed structures) and mean resolution (Res.) obtained for the given input LR image. Scalebar: \([0,~1]\) for RSM and \([0,~256]\) for rFRCMap from left to right.

Presentation

BibTeX


        @inproceedings{aetesam2025two,
        title={Enhancing Fluorescence Microscopy Resolution Beyond the Diffraction Limit via Cascaded Up-and Down-Sampling Networks},
        author={Aetesam, Hazique},
        booktitle={International Conference on Computer Vision and Image Processing},
        pages={179--190},
        year={2025},
        organization={Springer}
}